 Matlab
 Simulink
 NS3
NS3 OMNET++
 COOJA
COOJA CONTIKI OS
 NS2
NS2
PhD MATLAB research projects, along with several procedures that are generally involved are discussed in this page. Our writers and developers carry out in an appropriate and efficient manner by following the protocols. For your Ph.D. in MATLAB you can always rely on us we provide you with performance analysis and implementation results. For every procedure, we offer a well-formatted instruction and sample applications, including explicit codes:
- Data Acquisition
Explanation: From different sources like online repositories, databases, or sensors, we plan to obtain data.
Instance: Specifically from a CSV file, import data.
% Load data from CSV file
data = readtable(‘data.csv’);
% Display the first few rows of the data
head(data)
- Data Preprocessing
Explanation: Make the data appropriate for the analysis process by cleaning and preprocessing it.
Instance: Focus on standardizing data, managing missing values, and retrieving characteristics.
% Handle missing values by filling them with the mean of the column
data = fillmissing(data, ‘linear’);
% Normalize the data (assuming data is numeric)
dataNormalized = normalize(data{:, :});
% Convert the normalized data back to a table
dataNormalized = array2table(dataNormalized, ‘VariableNames’, data.Properties.VariableNames);
% Display the preprocessed data
head(dataNormalized)
- Data Analysis
Explanation: Intend to create models, implement machine learning methods, or carry out statistical analysis.
Instance: The principal component analysis (PCA) has to be carried out.
% Perform PCA
[coeff, score, latent, tsquared, explained] = pca(dataNormalized{:, :});
% Display the explained variance
disp(‘Explained Variance:’);
disp(explained);
% Plot the first two principal components
figure;
scatter(score(:,1), score(:,2));
xlabel(‘Principal Component 1’);
ylabel(‘Principal Component 2’);
title(‘PCA of Dataset’);
grid on;
- Data Visualization
Explanation: In order to acquire perceptions, we have to visualize the outcomes and data of the analysis.
Instance: To visualize data relationships and distributions, develop plots.
% Plot histograms of the features
figure;
histogram(dataNormalized.Var1);
hold on;
histogram(dataNormalized.Var2);
legend({‘Feature 1’, ‘Feature 2’});
title(‘Histograms of Features’);
xlabel(‘Value’);
ylabel(‘Frequency’);
grid on;
% Plot a correlation matrix
correlationMatrix = corr(dataNormalized{:, :});
figure;
heatmap(dataNormalized.Properties.VariableNames, dataNormalized.Properties.VariableNames, correlationMatrix);
title(‘Correlation Matrix’);
- Model Creation
Explanation: Through utilizing the processed data, predictive models must be created and verified.
Instance: Concentrate on building a regression model. Then, its performance should be assessed.
% Split the data into training and testing sets
cv = cvpartition(height(dataNormalized), ‘HoldOut’, 0.3);
trainData = dataNormalized(training(cv), :);
testData = dataNormalized(test(cv), :);
% Train a linear regression model
model = fitlm(trainData, ‘ResponseVar’, ‘Target’);
% Predict on the test set
predictions = predict(model, testData);
% Evaluate the model performance
mse = mean((testData.Target – predictions).^2);
disp([‘Mean Squared Error: ‘, num2str(mse)]);
% Plot the actual vs. predicted values
figure;
scatter(testData.Target, predictions);
xlabel(‘Actual Values’);
ylabel(‘Predicted Values’);
title(‘Actual vs. Predicted Values’);
grid on;
- Interpretation and Reporting
Explanation: For documenting in our thesis, prepare the outcomes by explaining them.
Instance: Plan to visualize major outcomes and outline the significant discoveries.
% Summarize the findings
fprintf(‘Principal Components Explained Variance:\n’);
disp(explained);
fprintf(‘Mean Squared Error of the Regression Model: %.2f\n’, mse);
% Visualize key results (e.g., feature importance)
figure;
bar(model.Coefficients.Estimate);
set(gca, ‘XTickLabel’, model.Coefficients.Properties.RowNames);
xlabel(‘Features’);
ylabel(‘Coefficient Estimate’);
title(‘Feature Importance in Regression Model’);
grid on;
PhD implementation using Matlab
MATLAB is examined as an efficient programming language and environment that is used in numerous PhD projects across various domains. By involving important domains like Environmental Science, Biomedical Engineering, Computer Science, Mechanical Engineering, and Electrical Engineering, we provide in-depth recommendations for PhD projects, along with initial points for MATLAB execution, and research goals:
- Electrical Engineering: Power System Optimization
Outline: Using combined renewable energy sources, the functionality of power grids has to be enhanced.
Research Goals:
- For power generation and usage, we aim to create models.
- Focus on incorporating storage frameworks and renewable energy sources.
- It is important to reduce losses and improve power flow.
MATLAB Execution:
% Power Flow Optimization
function f = powerFlowObjective(x)
% Define the objective function for power flow optimization
% Example: minimize power loss
f = sum(x.^2); % Simplified example
end
% Main script
numBuses = 5; % Number of buses in the power system
lb = zeros(1, numBuses); % Lower bounds for power generation
ub = ones(1, numBuses) * 100; % Upper bounds for power generation
options = optimoptions(‘particleswarm’, ‘SwarmSize’, 50, ‘MaxIterations’, 100);
[x, fval] = particleswarm(@powerFlowObjective, numBuses, lb, ub, options);
disp(‘Optimized Power Generation:’);
disp(x);
- Mechanical Engineering: Structural Health Monitoring
Outline: In mechanical constructions, track and examine structural wellness in actual-time by creating a framework.
Research Goals:
- For gathering of data, apply sensor networks.
- Specifically for impairment identification and localization, we build algorithms.
- By means of experiments and simulations, verify the framework.
MATLAB Execution:
% Structural Health Monitoring
function f = damageDetectionObjective(params)
% Example objective function for damage detection
% Simulate the structural response with given parameters
f = norm(params – trueParams); % Simplified example
end
% Main script
numSensors = 10; % Number of sensors
lb = zeros(1, numSensors); % Lower bounds for sensor parameters
ub = ones(1, numSensors) * 10; % Upper bounds for sensor parameters
options = optimoptions(‘particleswarm’, ‘SwarmSize’, 50, ‘MaxIterations’, 100);
[params, fval] = particleswarm(@damageDetectionObjective, numSensors, lb, ub, options);
disp(‘Optimized Sensor Parameters:’);
disp(params);
- Computer Science: Machine Learning Model Optimization
Outline: For particular applications like natural language processing or image recognition, we intend to enhance machine learning models.
Research Goals:
- Novel machine learning algorithms have to be created.
- For previous models, the hyperparameters must be improved.
- Make use of standard datasets to verify the models.
MATLAB Execution:
% Hyperparameter Optimization for Machine Learning
function f = svmObjective(params, X, y)
% Example objective function for SVM hyperparameter optimization
% Train SVM and calculate validation error
model = fitcsvm(X, y, ‘KernelFunction’, ‘rbf’, ‘BoxConstraint’, params(1), ‘KernelScale’, params(2));
cvmodel = crossval(model);
f = kfoldLoss(cvmodel); % Validation error
end
% Main script
load fisheriris % Example dataset
X = meas;
y = species;
lb = [0.1, 0.1]; % Lower bounds for hyperparameters
ub = [10, 10]; % Upper bounds for hyperparameters
options = optimoptions(‘particleswarm’, ‘SwarmSize’, 50, ‘MaxIterations’, 100);
[params, fval] = particleswarm(@(params) svmObjective(params, X, y), 2, lb, ub, options);
disp(‘Optimized Hyperparameters:’);
disp(params);
- Biomedical Engineering: Image Processing for Medical Diagnostics
Outline: In order to carry out medical diagnostics, innovative image processing approaches have to be created.
Research Goals:
- Employ reconstruction and filtering approaches to improve image standard.
- For automatic diagnosis, we create efficient algorithms.
- Use clinical data to verify the algorithms.
MATLAB Execution:
% Medical Image Processing
I = imread(‘mri_image.jpg’); % Load a medical image
I_gray = rgb2gray(I);
I_filtered = medfilt2(I_gray); % Apply median filtering
imshow(I_filtered);
title(‘Filtered MRI Image’);
% Example: Edge Detection
edges = edge(I_filtered, ‘Canny’);
imshow(edges);
title(‘Edge Detection’);
- Environmental Science: Climate Modeling and Simulation
Outline: As a means to simulate and forecast climate variations, we build robust models.
Research Goals:
- For different climate attributes, develop models.
- On the basis of various assumptions, simulate climate contexts.
- By utilizing previous data, verify the models.
MATLAB Execution:
% Climate Modeling and Simulation
function f = climateModelObjective(params)
% Example objective function for climate model optimization
% Simulate climate model with given parameters
f = norm(params – trueParams); % Simplified example
end
% Main script
numVariables = 5; % Number of climate variables
lb = zeros(1, numVariables); % Lower bounds for parameters
ub = ones(1, numVariables) * 10; % Upper bounds for parameters
options = optimoptions(‘particleswarm’, ‘SwarmSize’, 50, ‘MaxIterations’, 100);
[params, fval] = particleswarm(@climateModelObjective, numVariables, lb, ub, options);
disp(‘Optimized Climate Model Parameters:’);
disp(params);
To conduct each major procedure in research projects, an elaborate instruction is provided by us, along with brief explanations and clear instances. Relevant to various domains, we proposed some PhD-based project ideas, encompassing concise outlines, research goals, and MATLAB execution codes.
Subscribe Our Youtube Channel
You can Watch all Subjects Matlab & Simulink latest Innovative Project Results

Our services
We want to support Uncompromise Matlab service for all your Requirements Our Reseachers and Technical team keep update the technology for all subjects ,We assure We Meet out Your Needs.
Our Services
- Matlab Research Paper Help
- Matlab assignment help
- Matlab Project Help
- Matlab Homework Help
- Simulink assignment help
- Simulink Project Help
- Simulink Homework Help
- Matlab Research Paper Help
- NS3 Research Paper Help
- Omnet++ Research Paper Help
Our Benefits
- Customised Matlab Assignments
- Global Assignment Knowledge
- Best Assignment Writers
- Certified Matlab Trainers
- Experienced Matlab Developers
- Over 400k+ Satisfied Students
- Ontime support
- Best Price Guarantee
- Plagiarism Free Work
- Correct Citations
Expert Matlab services just 1-click

Delivery Materials
Unlimited support we offer you
For better understanding purpose we provide following Materials for all Kind of Research & Assignment & Homework service.
 Programs
 Designs
 Simulations
 Results
 Graphs
 Result snapshot
 Video Tutorial
 Instructions Profile
  Sofware Install Guide
 Execution Guidance
  Explanations
 Implement Plan
Matlab Projects
Matlab projects innovators has laid our steps in all dimension related to math works.Our concern support matlab projects for more than 10 years.Many Research scholars are benefited by our matlab projects service.We are trusted institution who supplies matlab projects for many universities and colleges.
Reasons to choose Matlab Projects .org???
Our Service are widely utilized by Research centers.More than 5000+ Projects & Thesis has been provided by us to Students & Research Scholars. All current mathworks software versions are being updated by us.
Our concern has provided the required solution for all the above mention technical problems required by clients with best Customer Support.
- Novel Idea
- Ontime Delivery
- Best Prices
- Unique Work
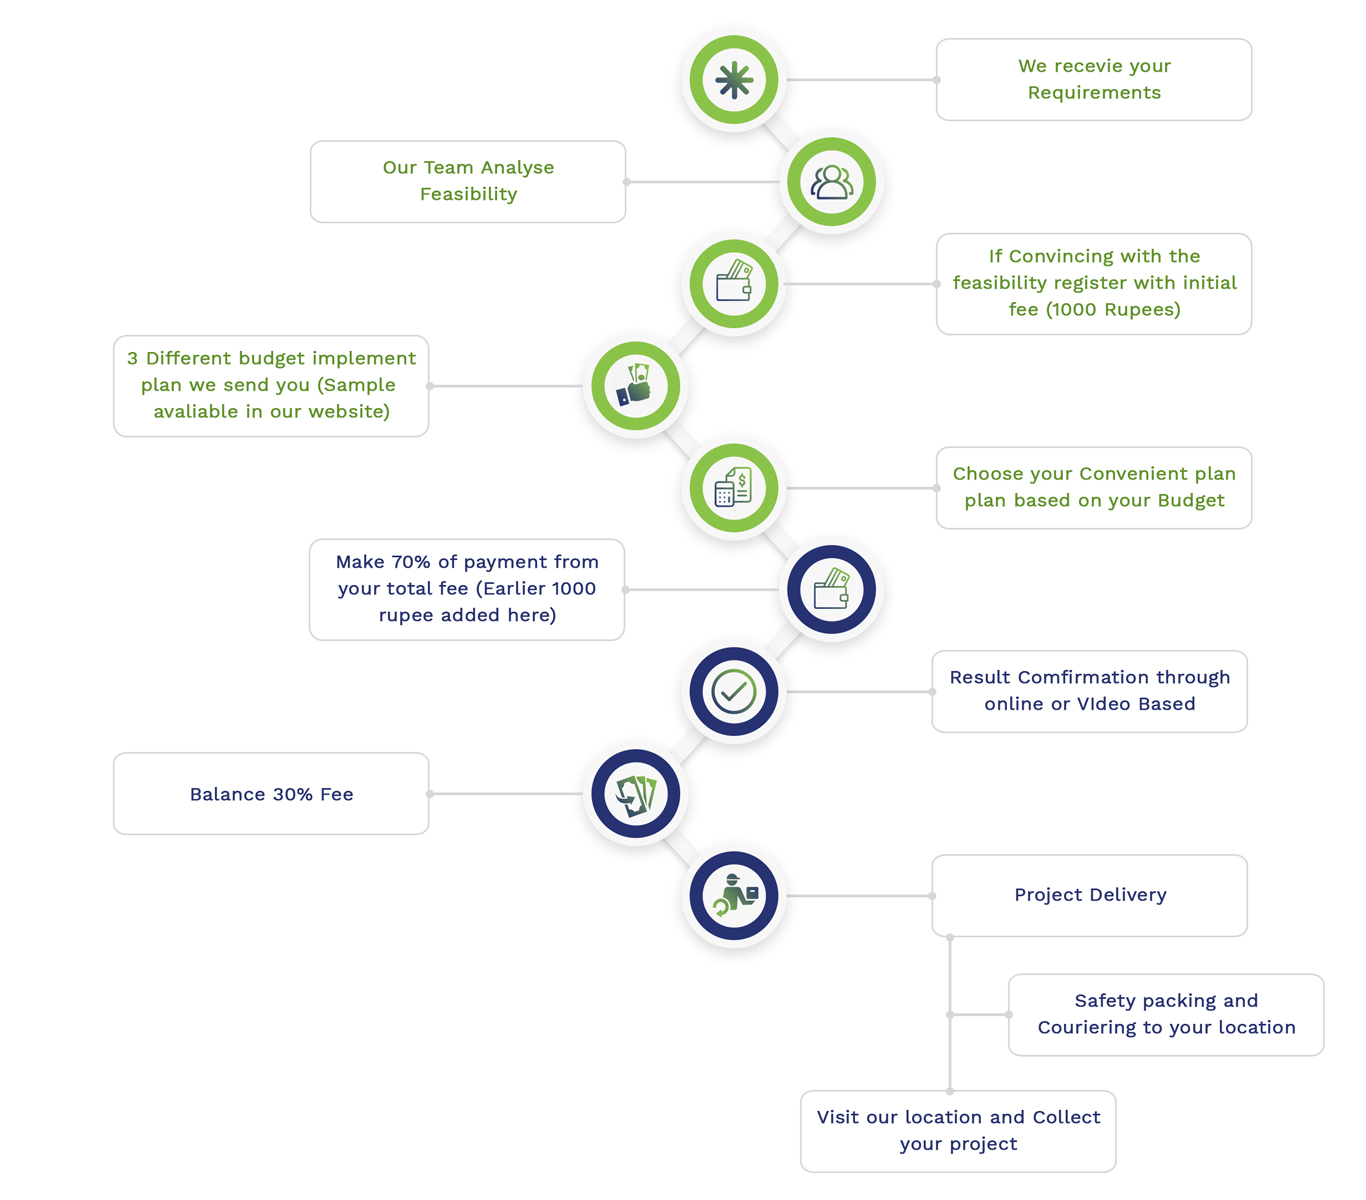
Simulation Projects Workflow
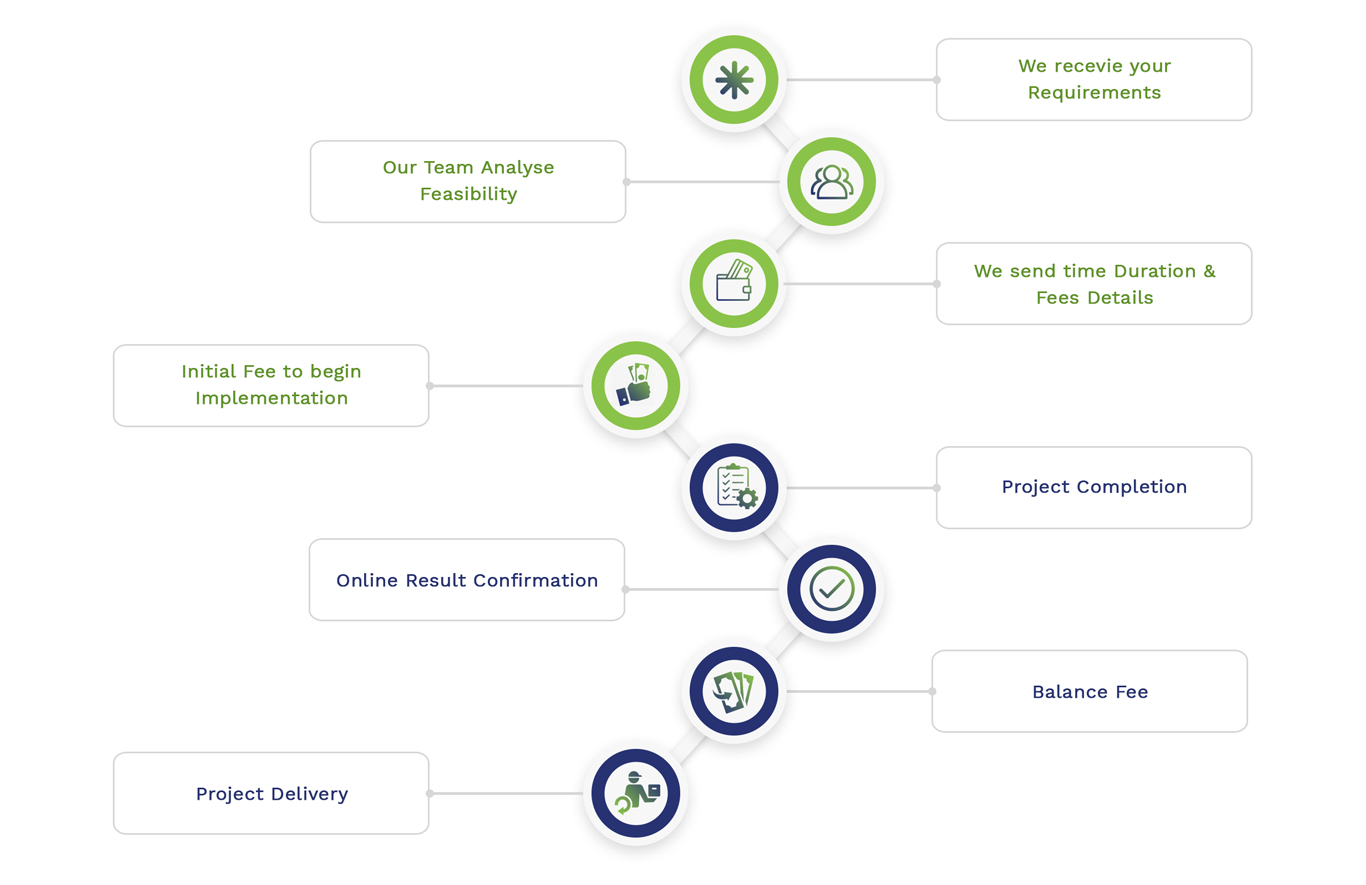
Embedded Projects Workflow